In Australia Housing Is The Economy
The Other Half Of The Precarious Bi-Pod Supporting Australia's Economy
Last month here at the Avid Commentator Report I covered Australia’s reliance on mineral exports to China and how vital it was to the Treasury coffers of the federal government, to supporting the strength of the Australian dollar.
Today we’re going to be looking at the other half of the precarious looking bi-pod that supports the bulk of the Australian economy, the housing market and the extremely high prices that define it.
It may sound like something of an exaggeration to describe what appears to the outside as an affluent Western economy worth over $2.5 trillion (AUD) as precarious, but when one looks at the data it becomes clear that things are quite a bit different than they appear at first glance.
We’ll start off by looking at the size of the Australian residential housing market relative to other nations to provide a bit of perspective, before getting into how this helps power day to day economic activity.
An Enormous Driver Of Household Wealth
When housing markets are compared at a national level, one of the metrics often used is the ratio of the value of housing stock to GDP. But this can measure can be distorted by GDP drivers such as corporate profits or resources exports.
In order to get a more accurate read on where the current value of Australian housing sits relative to its peers, we’ll be looking at the ratio of the value of total housing stock to gross household/personal disposable income (total gross household income minus taxes and government transfers) across different nations.
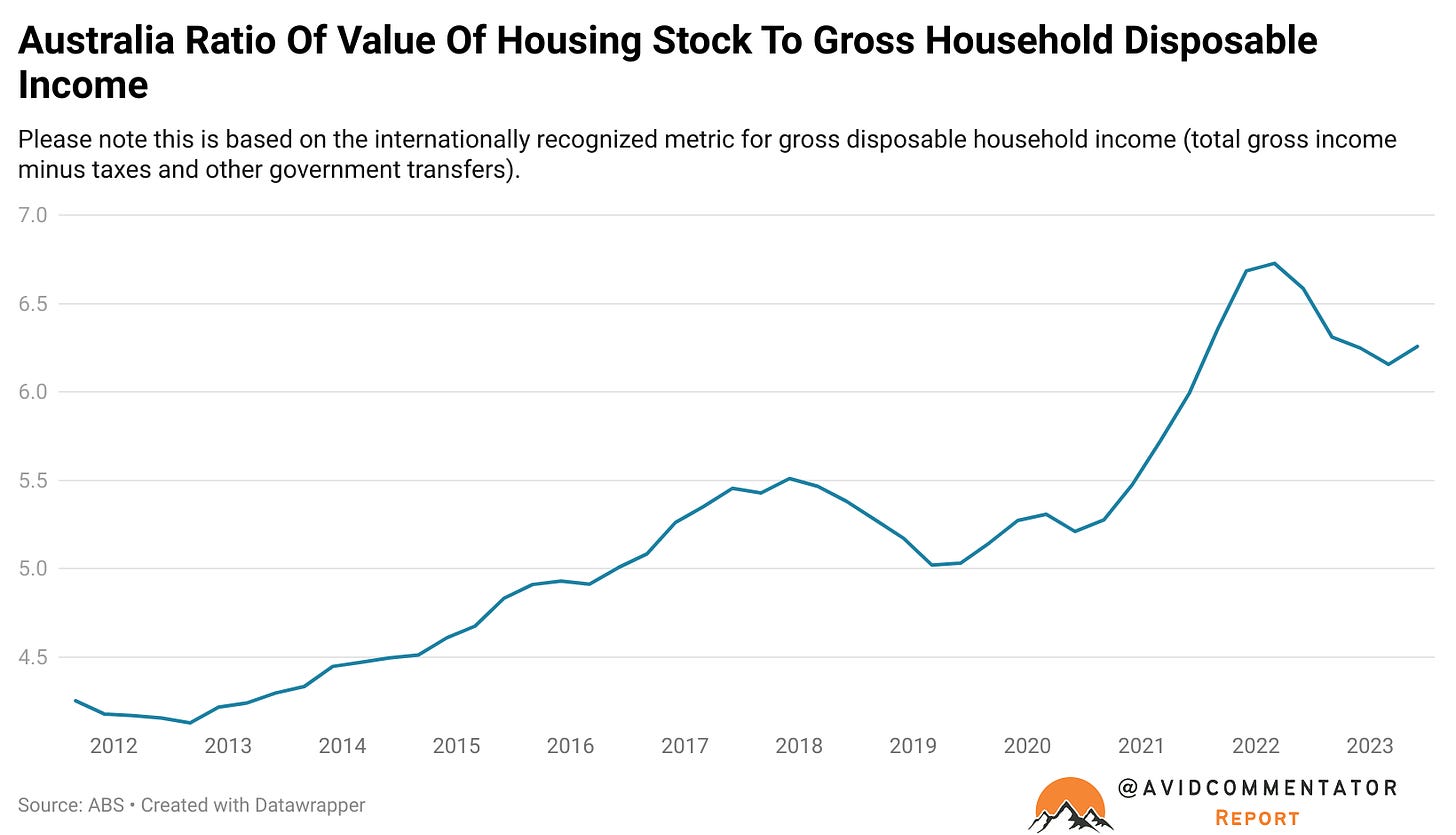
According to the latest data from the Australian Bureau of Statistics (ABS) which covers up to the end of Q2, the total value of Australia’s housing market is 625.7% of gross household disposable income.
To put this into perspective, the total value of U.S housing stock is 230.8% of gross personal disposable income. At the other end of the spectrum in China, which has one of the most overvalued housing markets in the world, residential housing stock is worth 856.5% of gross personal disposable income.
Tapping That Wealth? Equity Mate!
For over 30 years there have been papers on the impact of the wealth effect. In short, this describes the propensity of consumers to spend more if their assets such as stocks and housing increased in value. Various research papers by academics, central banks and the Bank For International Settlements have noted that the wealth effect from rising housing prices is particularly potent in spurring additional consumer spending.
In Australia, in the late 1990s, the wealth effect was taken to its logical conclusion. With its ‘Equity Mate’ advertising campaign in the late 1990s, the Commonwealth Bank (Australia’s largest bank) encouraged borrowers to use a home equity withdrawal to do everything from buying a boat to going on holiday.
By popularizing the tapping of home equity for cash to do everything from fuel additional household consumption to providing a family or small business with cheaper and more accessible credit, the transmission mechanism by which housing prices act on the economy became formalized and far more direct than the traditional wealth effect.
Over time, home equity withdrawals went from something resembling a rounding error, to a $92 billion a year (in the year to June 2021) force with a major influence on the broader economy. To put the size of annual home equity withdrawals into perspective, total personal income stemming from employment and superannuation (Australia’s private pension system) was $983 billion in 2019-20 (the latest available data).
With home equity withdrawals amounting to 4.5% of GDP at last count, ‘Equity Mate’ as its otherwise known domestically is a key driver of the Australian economy and likely a major factor in older demographics maintaining strong real consumption growth in the post-GFC era even as under 35’s went no where on this metric prior to the pandemic.
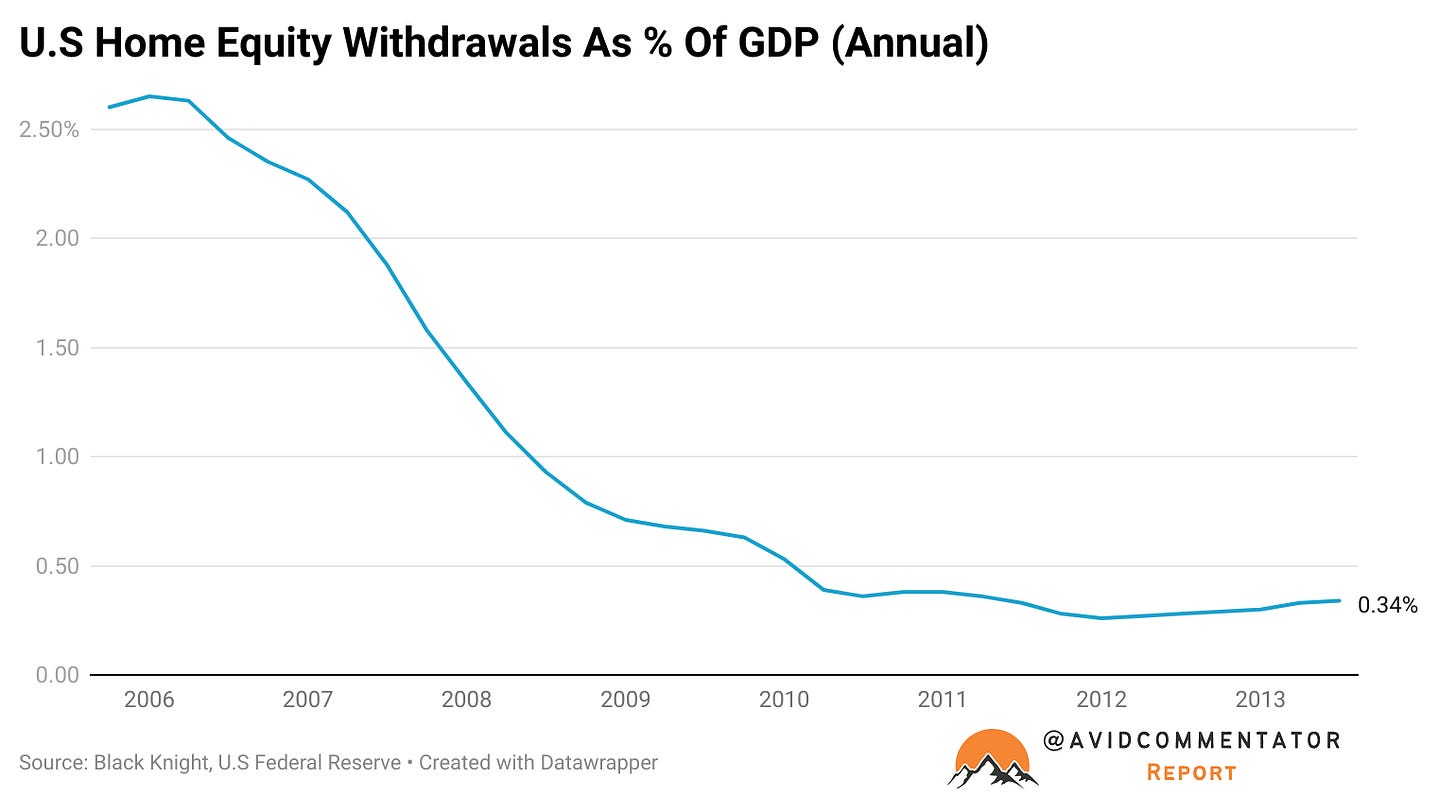
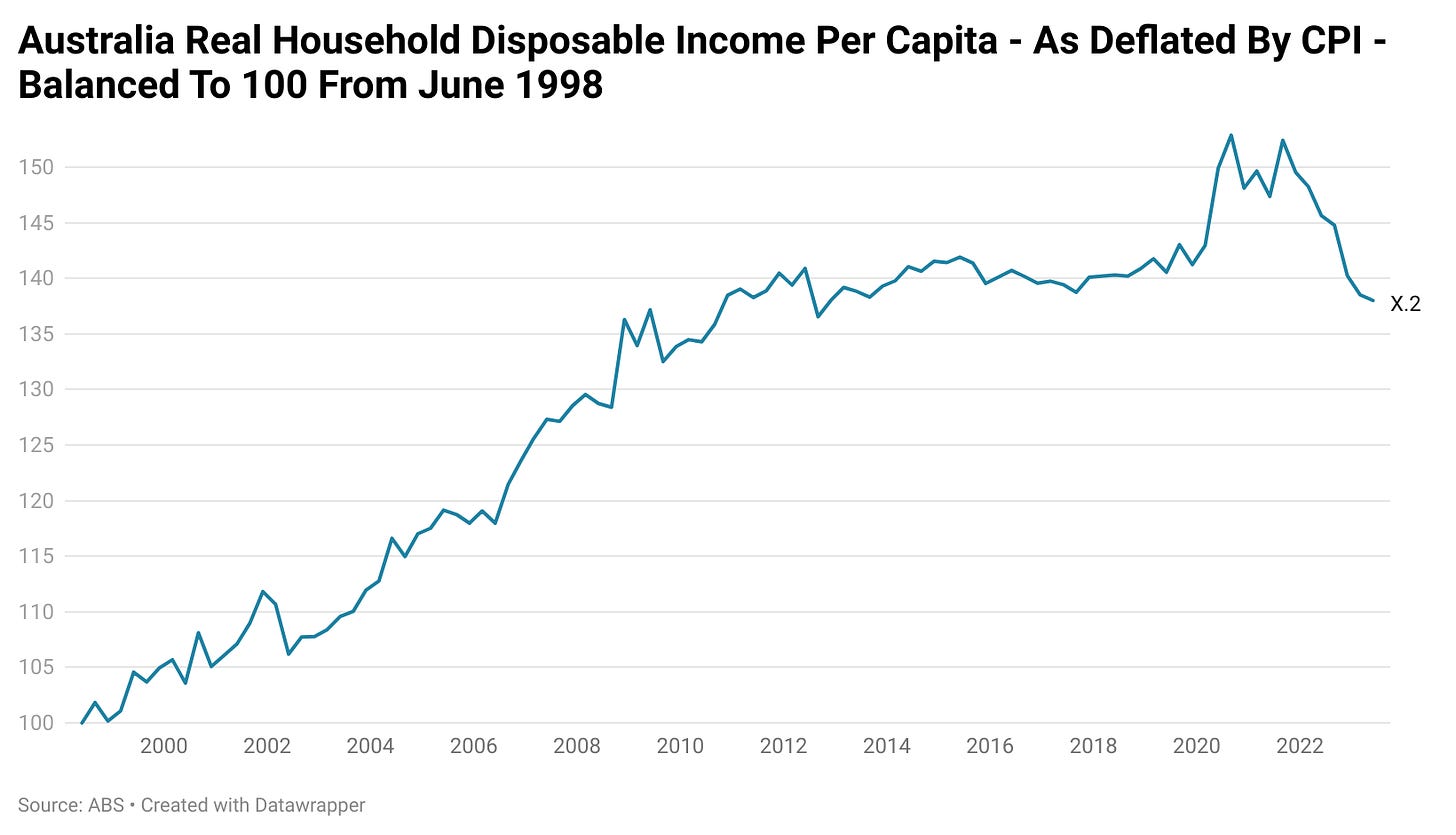
If this major driver of household consumption and broader economic activity was to be reduced by a similar proportion to home equity withdrawals in the U.S from 2006 onwards, it would represent such a significant headwind for the economy that may be hard to overcome, particularly given that the economy is already in a recession in per capita terms.
Inherited Wealth
In recent years there have been all manner of headlines talking about the ‘Great Wealth Transfer’ that is to come as the Silent Generation and older Baby Boomers bequeath their assets to their descendants. This was always going to be a driver of additional household consumption, but with the advent of the pandemic and the change to consumer psychology, the expenditure of inherited wealth has taken on a significantly greater role.
With Australian housing worth more than twice as much as much as U.S housing in relative terms (index to GDP), when Aussie households inherit wealth there is significantly more on offer.
According to the ABS a little under 67% of the average household wealth stems directly from property. A 2021 paper authored by the federal government’s Productivity Commission concluded that as of 2018 the total outflow of inheritances was $107 billion per year. Based on these numbers we can estimate that roughly around $71.5 billion in property driven inheritances change hands each year.
A 2019 Grattan Institute report found that over 80% of inheritances by dollar value not flowing to a spouse went to recipients over the age of 50 and over 60% flowed to beneficiaries over the age of 55.
While these windfalls general prompt additional consumption, from a more comfortable lifestyle to holidays with the grandkids, Grattan Institute data shows that for households over 60, non-housing financial wealth generally continues to grow over time and not be drawn down.
But this data all stems from prior to the pandemic.
Today, the 55 to 64 and 65 and over demographics in aggregate are seeing the largest increases in annual household spending, while households under the age of 35 are seeing their nominal household spending fall.
One of the big questions going forward is how much has the consumer psychology profile of older households changed with a degree of permanency. The answer to this question has potentially major implications for the fight against inflation in the short term and the health of the broader economy in the long term.
This may see an even greater proportion of Australia’s economic activity driven directly by wealth stemming from property.
Property Is The Key State Revenue
Unlike in the United States where states have the power enact personal income taxes and state sales taxes, or parts of Europe where provincial authorities hold far less responsibilities, in Australia the revenue base under the control of various states is quite narrow. While states are provided with additional revenue in the form of grants from the nationally levied ‘Goods And Services Tax’ (GST) or royalties from resources production, their ability to raise further large sums of revenue of their own volition is relatively limited.
This comes in spite of the fact that the various state governments are responsible for healthcare, education, transport and a number of other vital government services. Meanwhile, the federal government has control over the level of migration into the country, which as one might imagine directly and heavily impacts the requirements for various government services.
The division of responsibilities between the states and the federal government also saw state based spending surge, resulting in large deficits and concerningly high levels of debt relative to revenue.
Enter the property angle.
One of the key sources of revenue for the states is stamp duty aka land transfer duty, generally payable when a property is purchased, with exceptions for eligible applicants such as first home buyers purchasing a home under a select threshold.
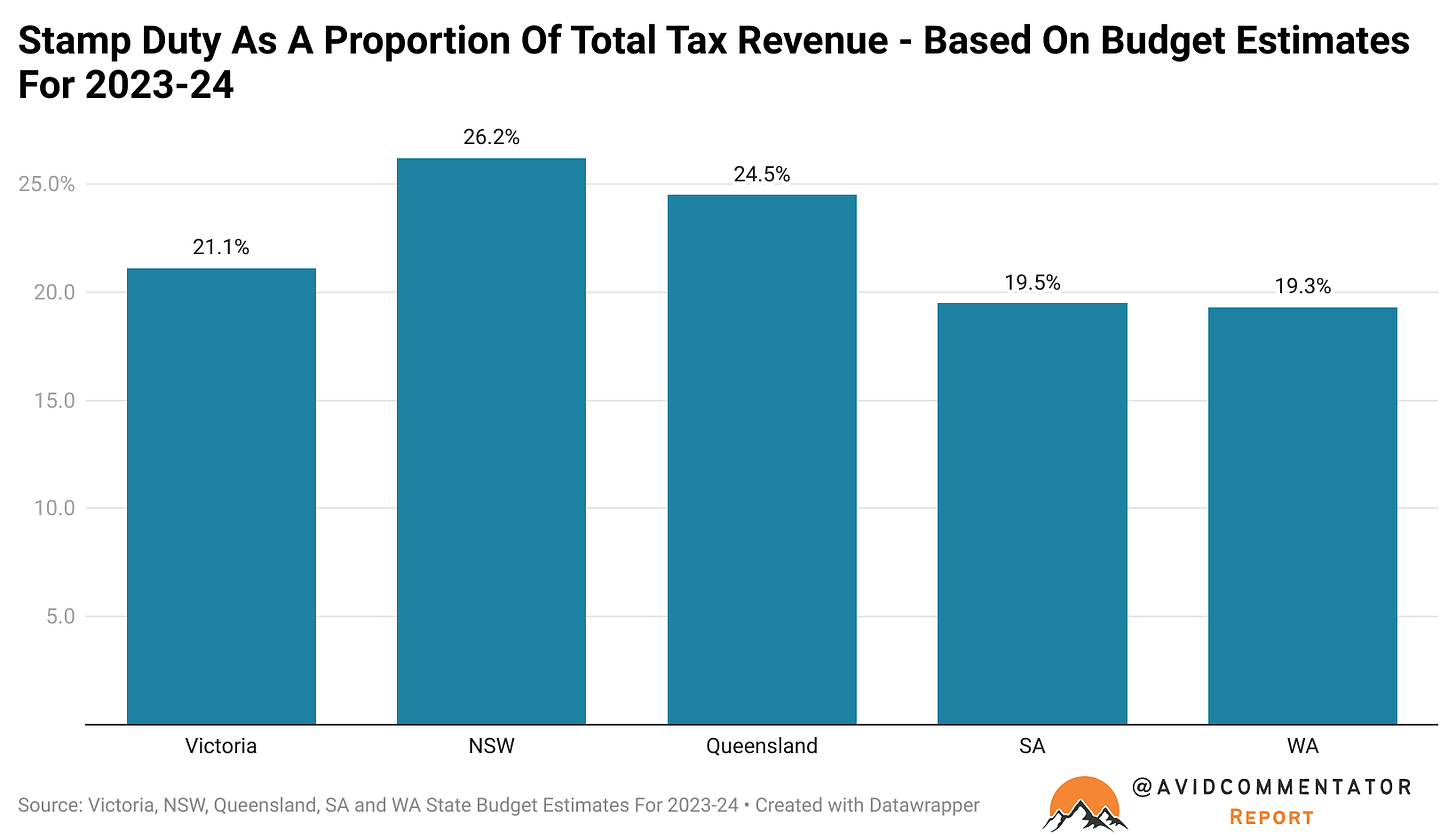
Across the various states, stamp duty represents between 19.3% and 26.2% of total tax revenue (this does not factor in revenue from federal grants or royalties from the resources sector) based on the forward estimates contained in each of the five largest state’s budgets for the 2023-24 financial year.
Part of the issue of the various state governments is that stamp duty is a transaction tax. In the early 2000s up to 9.0% of property was turned over in a given year, but today the housing turnover rate sits at just 4.26%, less than half that.
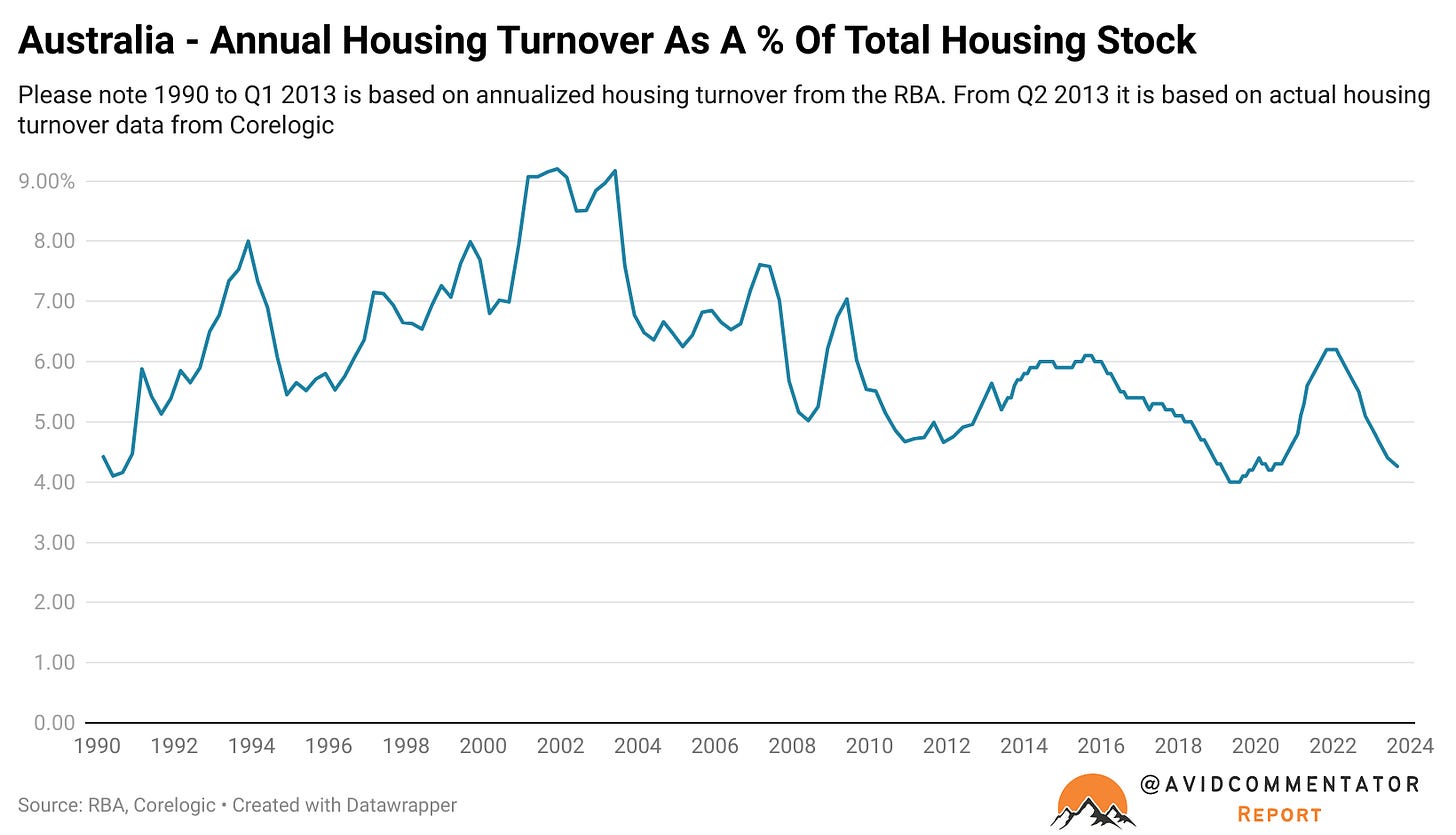
An element of this decline in turnover is as a result of demographics. Once households reach their late 50s, the chance of them moving begins to decline toward near zero over time, with a surge much later in life as they either pass away or move into some form of assisted living. But even after attempting to account for this force acting on housing turnover, property turnover remains at a recession lows when compared to historic norms.
So if property prices were to head south in a big way, state government’s would take a double hit, one from households clamming up and refusing to list their properties (as we’ve seen from October 2022 onwards) and another from a lower level of revenue from each individual sale.
Hopelessly Reliant
When all these factors are combined, its clear how much various levels of government and households are reliant on high housing prices. If circumstance were to reduce this major driver of household consumption and tax revenue to levels consistent with those present with other nations, Australia’s economy would look quite different.
Instead of having consumption growth propped up by a relatively limited demographic of generally older and/or more affluent households, it would need to be driven through strongly rising productivity and real income growth, two things that have been hard to come by in Australia for quite some time.
For now the threats to the Aussie market remain on the horizon, but they can be seen in the distance. Mortgage arrears remain low, but its unclear to what degree this is driven by the impact of policies of ‘Extend and Pretend’ and simply the delay between interest rates rising and the impact on arrears. After all, two years after the start of the Federal Reserve hiking cycle that would result in the U.S housing crash and the Global Financial Crisis, U.S mortgage arrears had risen by just 0.02 percentage points.
How the high housing price driven elements of the economy will weather a potential recession remains to be seen, particularly if a downturn is accompanied by a major deterioration in Chinese demand for bulk commodities as its own property sector continues to struggle.
— If you would like to help support my work by making a one off donation that would be much appreciated, you can do so via Paypal here or via Buy me a coffee.
If you would like to support my work on an ongoing basis, you can do so by subscribing to my Substack or via Paypal here
Regardless, thank you for your readership and have a good one.





Tarric,
nice summary!
consider:
just prior to the GFC, the US housing mk value - 27.4Tn, debt was 9.3Tn, and pop was 305m
anyone can do the multiples re Oz.
Sadly - the kitchen sink has been thrown
its now big enough to actually imperil our banking system.....
just imagine if we had a productive economy