If It Feels Like Its Harder To Buy A First Home In Australia, That's Because It is
More prospective buyers competing for less and less stock on market than historically
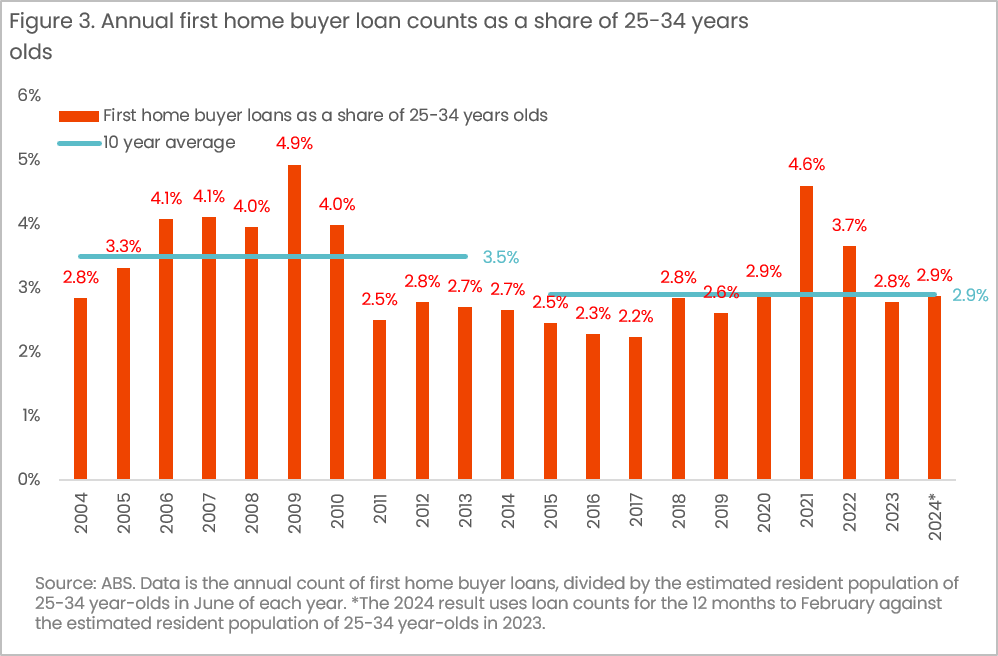
Recently Corelogic produced an interesting analysis detailing what proportion of the population aged 25 to 34 was represented in a single rolling year worth of first home buyer finance commitments.
The deterioration in first home buyer activity relative to their share of the population was clear, but several commenters asked what about prior to 2000 and the introduction to the capital gains tax discount. So I set to work going through the ABS’s data archive and historical population pyramids.
What I found was arguably even more interesting than the continuation of Corelogic’s analysis what I initially set out to achieve, but we’ll get back to that shortly.
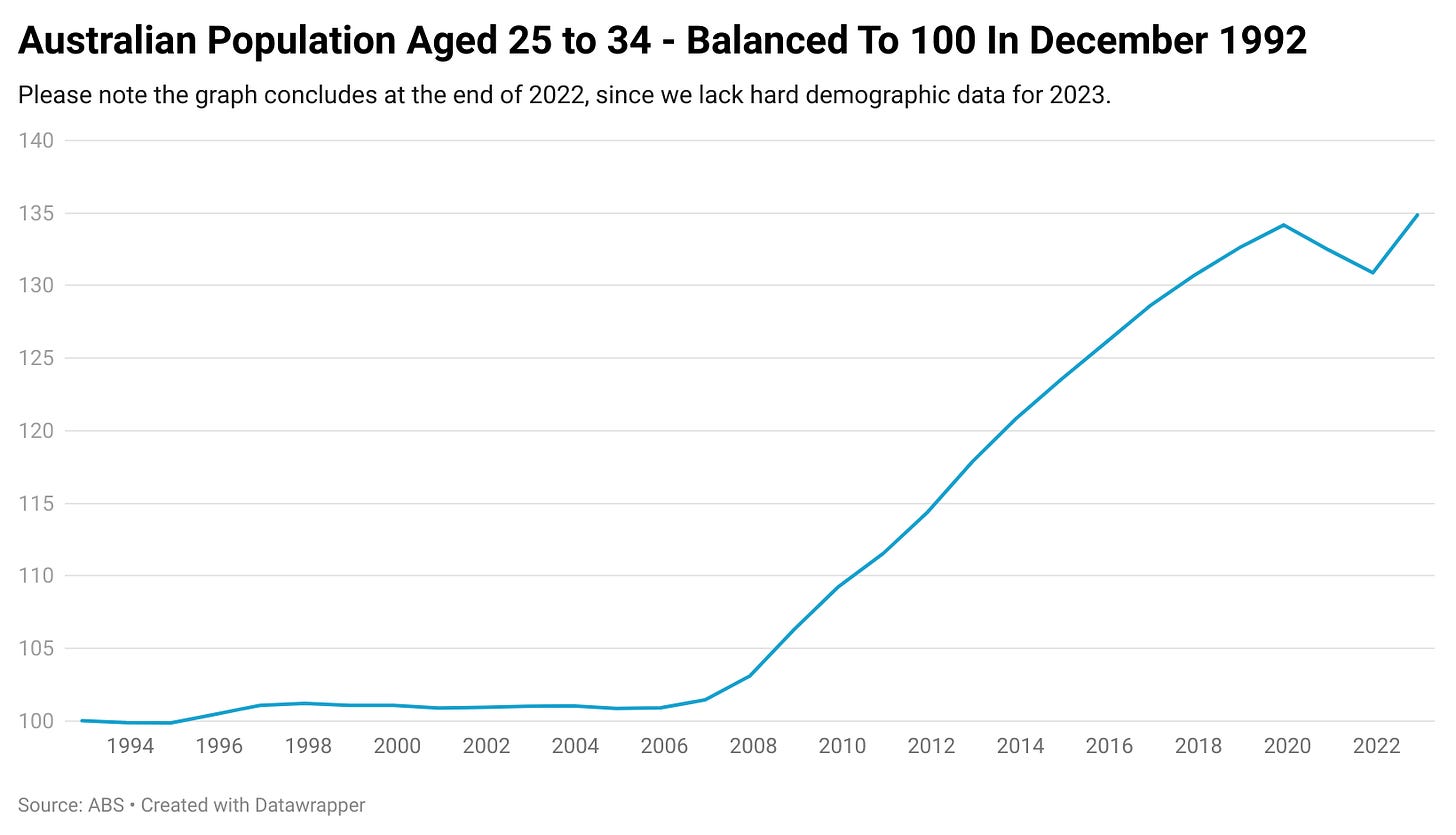
Between December 1992 and December 2005, the size of the Australian population aged 25 to 34 cumulatively increased by 0.89%. In 2006, it increased by 0.54% and in 2007 by 1.61%. In just two short years the 25-34 population had seen more double the growth it had seen in the prior 13 years worth of data.
Between the end of the low growth period in December 2005 and December 2022, the population aged 25 to 34 increased by 33.7%.
Between the start of our data set in December 1992 and December 2005, the number of people of prime first home buyer age was relatively static and competition against other first home buyers gradually got easier at least on paper, due to improving demographics and strong growth in overall dwelling stock.
Its worth noting that when viewed outside the vacuum of first home buyer vs first home buyer competition, things got much harder toward the end of this era as the impact of the doubling of the First Home Owner Grant and the introduction of the Capital Gains Tax Discount drove much greater levels of demand amidst loosening lending standards.
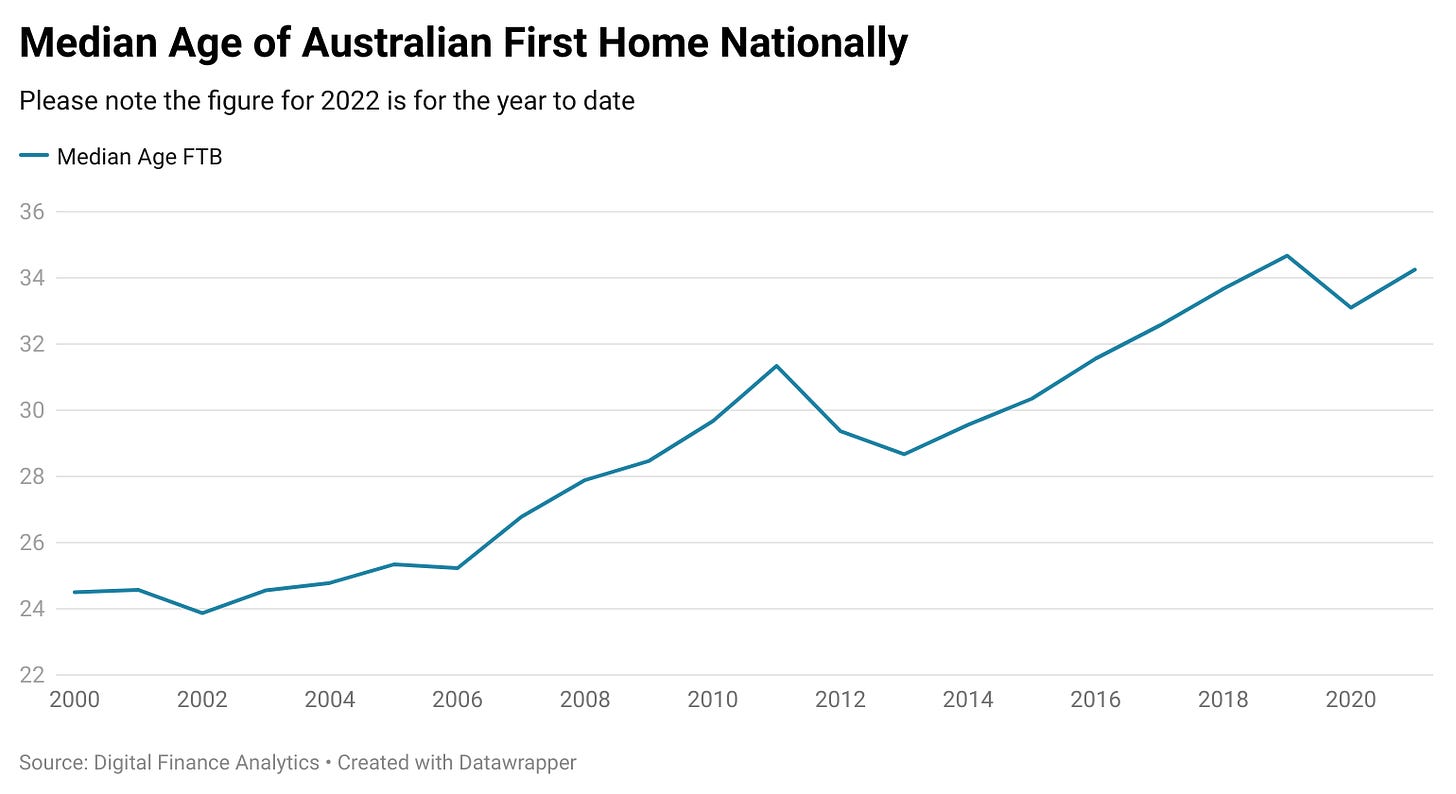
But since 2005, things have got significantly more challenging. Instead of competing with fellow first home buyers who were at the median generally in their 20s, the age range of first home buyers has expanded significantly, adding to the pool of potential competitors. According to data from Digital Finance Analytics, in the early to mid 2000s, the median first home buyer age was roughly 24-26 years of age, compared with over 34 years of age today.
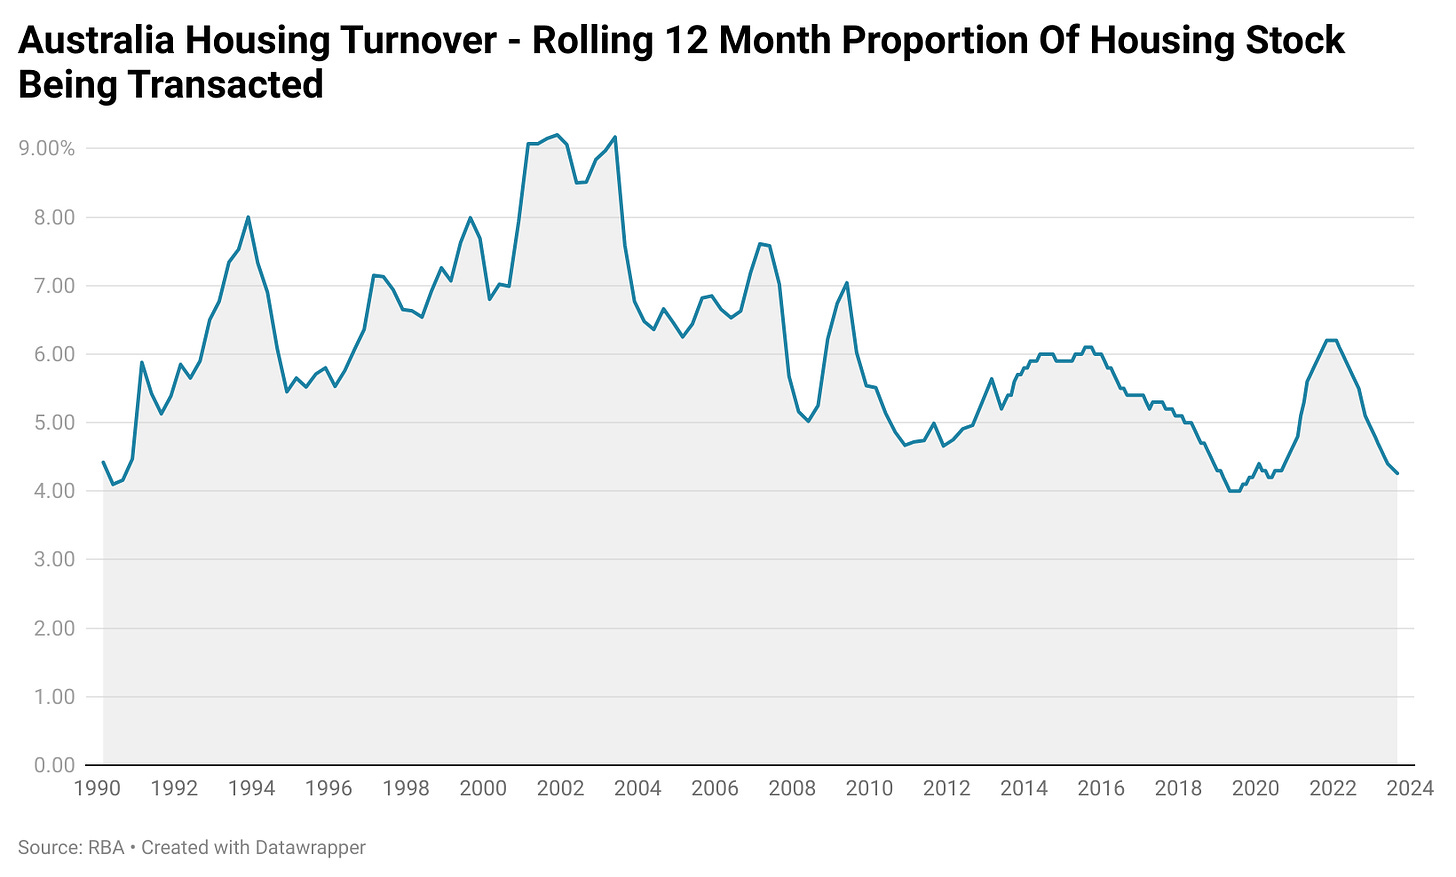
On the other side of the ledger, the proportion of overall housing stock being sold in a given year peaked in the early 2000s at more than 9% of housing stock. Today housing turnover has more than halved from its peak to sit at just 4.2%
The Impact
While this is far from the sole driver of upward pressure on housing prices, it is a significant factor. When the pool of buyers is growing by an average of over 2% per year, its impact is not dissimilar conceptually to that of the Baby Boomers during the 1970s and 1980s, as the demographic bulge they represented put upward pressure on demand for all manner of goods and services.
With housing turnover continuing to remain weak and in some locales outright falling, the impact of a growing cohort of buyers and dwindling pool of available homes in relative terms appears self evident.
Return From The Tangent
The ABS has data on the number of first home buyer finance commitments going back to 1991. In the first decade worth of data the number of first home buyer finance commitments represented an average of 3.83% of the population aged 25-34 each year. In the decade prior to the pandemic, the average had fallen to 2.78% of the population.
Relative to the proportion of first home buyers purchasing in the late 90s and very early 2000s, there were 368,500 fewer first home buyers in the decade prior to the pandemic.
While 2021 saw a surge in first home buyer activity that eclipsed the average level of activity seen between 1992 and 2001, it is the only year since 2009 (which was influenced by the doubling of first home buyer grants) to achieve that feat.
Taking Stock
There is a fairly widespread narrative about Gen Y and Gen Z not working hard enough or sacrificing enough to make home ownership work. But as the data has illustrated, fewer people are getting across the home ownership line due to greater levels of competition, much lower levels of turnover and higher prices.
On the other side of the coin, the oldest member of Gen Y is now 44 years old and part of a labour market in which there is the highest proportion of the work force with two jobs in the history of the data series.
The simple reality is today’s first home buyers are competing against a rapidly and ever increasing pool of fellow prospective first time buyers, in an environment where demographics is reducing turnover, in what I like to call ‘Australia’s Great Housing Lockdown’.
In short, as the proportion of housing stock held by over 60s continues to grow the level of turnover declines accordingly. This will be explored in great data driven detail in a Substack article further down the road.
Ultimately, this is just one factor among several major drivers of unaffordable housing, but it also serves as a lesson that basic supply and demand economics very much applies to the property market, if demand keeps increasing at a greater rate than supply (stock on market) then it will place upward pressure on prices. How that ends up balancing out on the metaphorical scales against other factors on the day is another matter.
— If you would like to help support my work by making a one off contribution that would be much appreciated, you can do so via Paypal here or via Buy me a coffee.
If you would like to support my work on an ongoing basis, you can do so by subscribing to my paid Substack


