


Australia Is Consuming Its Young
And Why It Impacts Everyone (Almost)


In the Australian debate surrounding the challenges faced by younger demographics and non-home owners, the commentary is often reduced to hyperbole about people spending too much money on takeaway coffees, smashed avocado and trips to Bali.
The truly ironic thing? Hard data from the Australian Bureau of Statistics (ABS), which has also been referenced in reports by the RBA suggests that not only are young people not spending irresponsibly in aggregate, but that the growth in the real spending of under 35s has gone either nowhere or backwards when compared with where it was in 2003-2004.
It’s worth taking a moment to reflect on that statistic. It’s like the average household led by under 35’s in 2010 having the same real consumption as their predecessors in the same age demographic in 1992.
It’s the absolute antithesis of the experience of some older demographics who enjoyed more real wage growth in some six month periods than today’s young people have enjoyed cumulatively in net terms over the last 20 years.
In order to assess how different demographics have fared over the last few decades and how that has impacted the broader economy, we’ll be looking at the following:
Distribution of real wage gains under historic conditions
Growth in real wages across different age demographics (2001 to 2008, 2008 to 2018)
To what equivalent past year have the real wages of different age demographics fallen to
Changes in real household consumption by age demographic
Real wages post-mining boom to illustrate how things changed from the broader economy
Impact of inheritances and superannuation withdrawals over time
Evolution of living standards across the decades (why we all lose), real wages and real household disposable incomes
But before we get into the numbers on how things have played out in reality, we’ll be taking a look at a snapshot provided by the Australian Productivity Commission of how real wages evolved between 2001 and 2008, as a guide of how the gains of an economy are distributed across different demographics under more historically normal conditions.
A Rising Tide
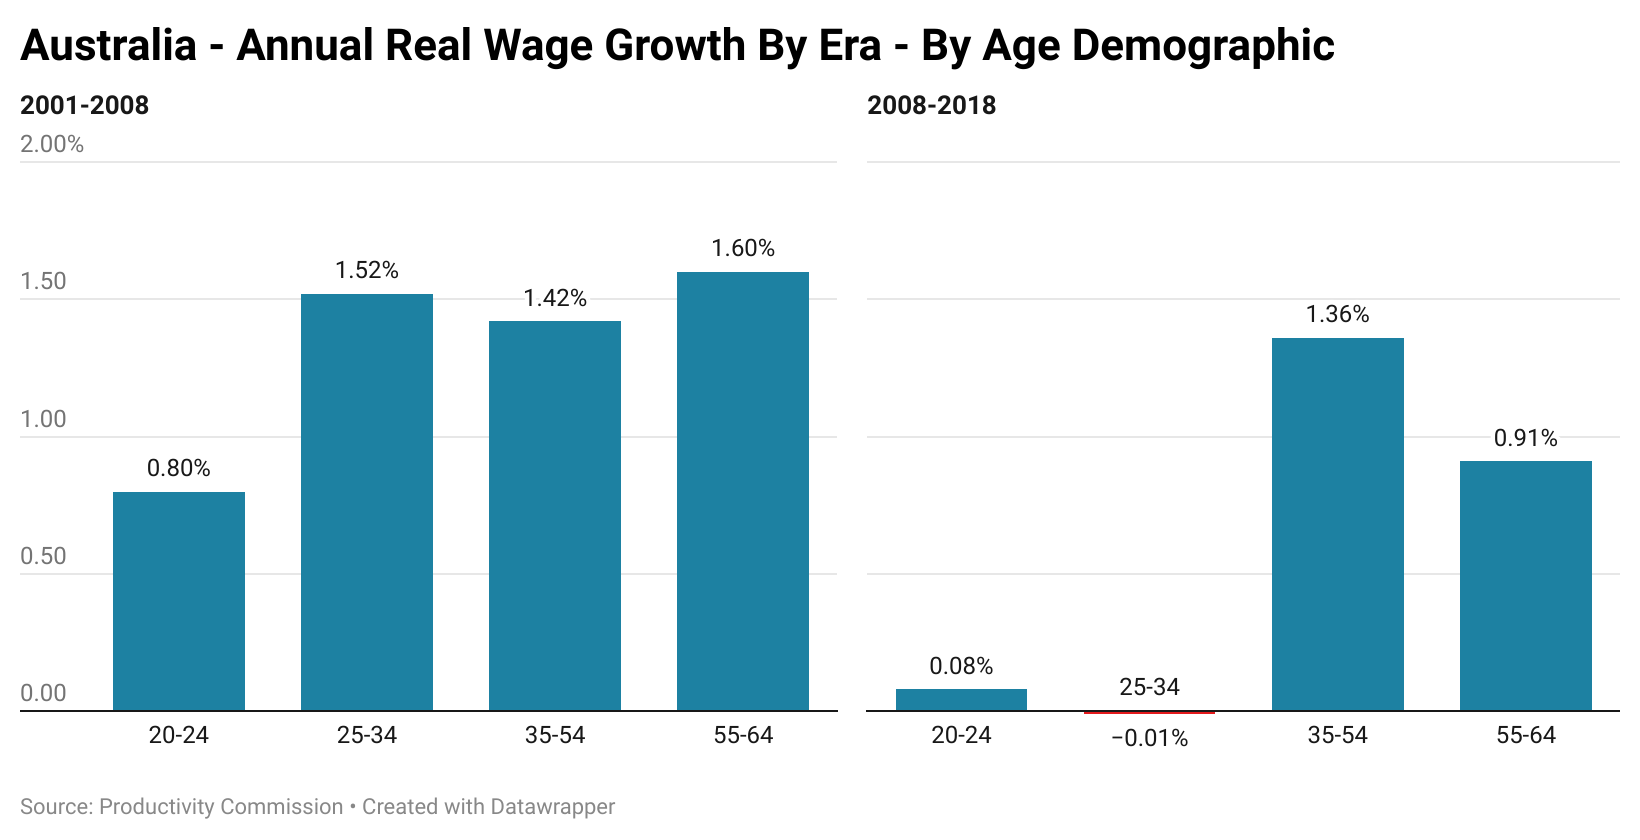
During this time real wage growth was broad based across the different age demographics, lifting real wages for all wage earners aged 20 to 64 (workers over 65 were not included in the analysis).
The weakest result was for those aged 20-24, whose real wages grew by an average annual rate of 0.80%. The strongest, those aged 55 to 64 with growth of 1.6% per year.
This period saw living standards as expressed by real household disposable income per capita enjoy the strongest rise since records began for this metric, growing by 27.5%. As of the latest release of the national accounts, real household disposable income per capita is at roughly the same level as Q4 2014.
While the strength of the increase in living standards between 2001 and 2008 was extremely robust by historic standards, the distribution of gains across the various age demographics was perfectly normal.
The World Changed
Despite being a defining moment in the economic history books of most major economy’s, for Australia the Global Financial Crisis is instead often remembered in the nation’s collective consciousness as yet another bullet dodged by ‘The Lucky Country’.
Yet in reality, it helped kick off a sequence of events that would transform the nature of employment growth, the growth drivers in the economy and drive a deep divergence in economic outcomes across Australia’s different age demographics.
What was a relatively balanced set of real wage gains across the different age demographics radically shifted as real wages growth for under 35s became more or less non-existent. In 2001 to 2008, 20-24 year olds saw average annual real wages growth of 0.8%, between 2008 and 2018 it fell to 0.08%. For 25 to 34’s the news was even worse, with growth falling from 1.52% per year to -0.01% per year.
Meanwhile, gains for 35 to 54’s remained robust at 1.36% per year (vs 1.42% previously) and 55-64’s saw a significant moderation from 1.60% per year to 0.91% annually.
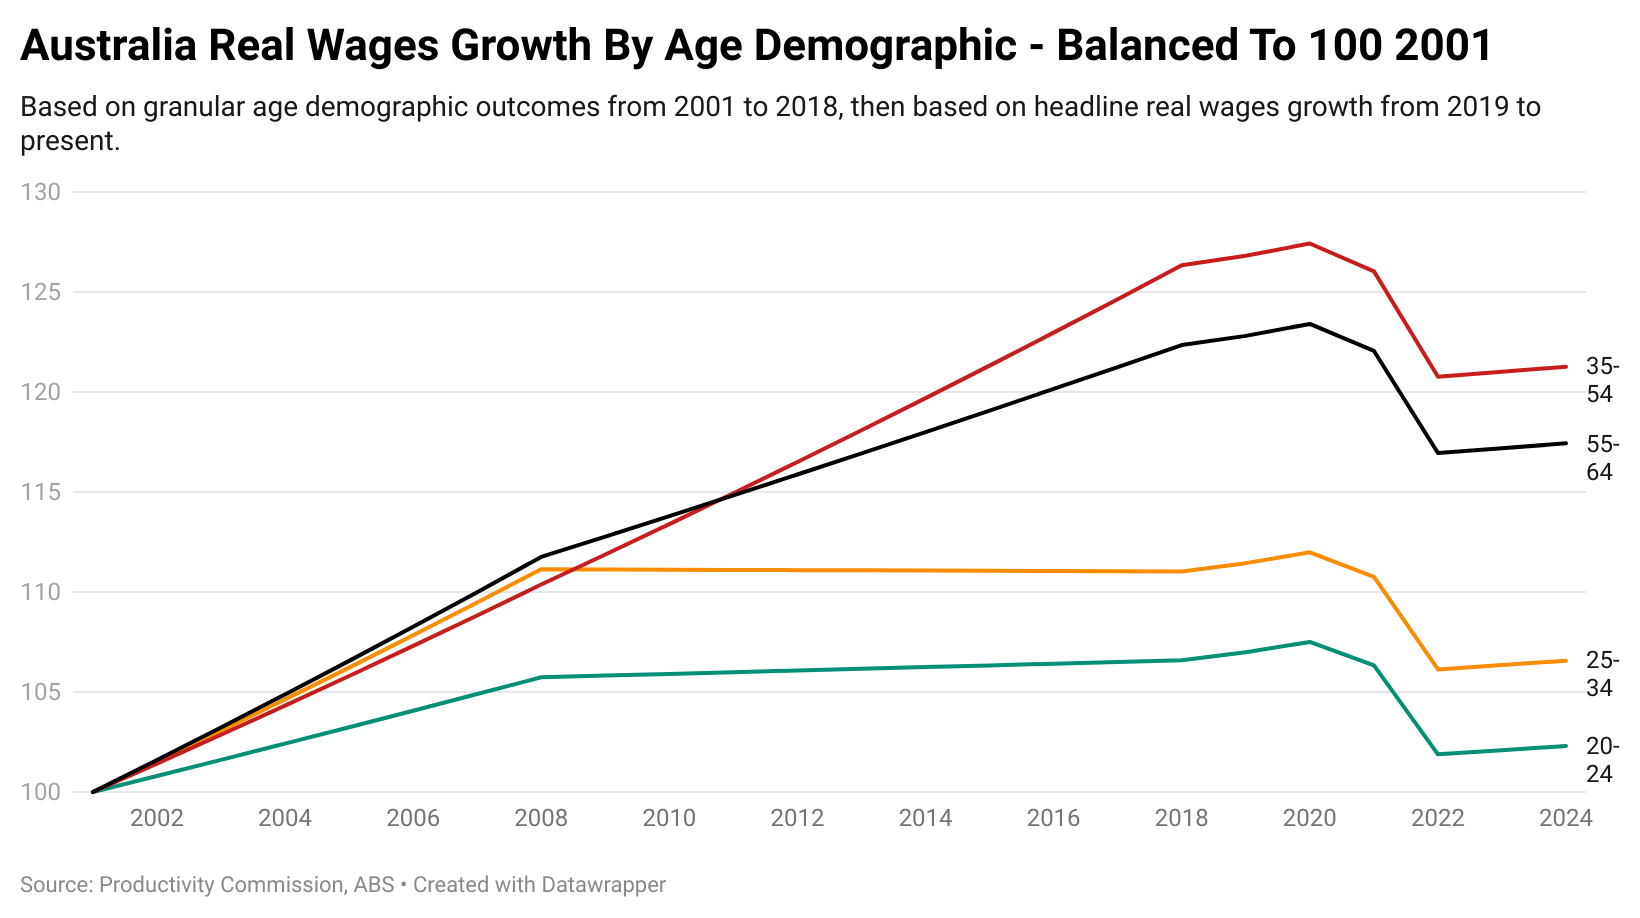
Amidst the fall in real wages that has been seen since the pandemic, we’ll be using broader real wage data from 2019 onwards to calculate how much real wages have deteriorated and what year real wages in 2024 is equivalent to across the different age demographics.
Naturally this method has its shortcomings and is potentially significantly exaggerating the wage gains of under 35s from 2019 onwards, but it’s the best data that is currently available. If you know of a different data source with more up to date figures, please comment below.
For individuals aged 20 to 24 their real wages are currently at the same level as 2004, for those aged 25 to 34, they are at levels last seen in 2006. As is becoming something of a theme, the news for those 35 to 54 is somewhat better, with their real wages at 2015 levels and those of 55 to 64 at 2013 levels.
When it comes to real wages, no traditional working age demographic seems to be winning, they are just losing less. But that is only part of today’s story.
Keep reading with a 7-day free trial
Subscribe to Avid Commentator Report to keep reading this post and get 7 days of free access to the full post archives.