Since the concept of the Australian fixed rate ‘mortgage cliff’ first came to light in the early part of last year, it has been a topic of great debate and speculation. Some have written it off as a “nothingburger", sharing their view that it would not be a major issue due to households preparing for it.
Data from Digital Finance Analytics suggests that around half of households rolling off on to a variable rate have prepared for the eventuation, while the other half’s preparations range from mild to non-existent.
My view has long been that as long as rates stay high, the ‘mortgage cliff’ would eventually become a major issue for borrowers and the banks. Although issues are far more likely to occur in waves over a protracted period rather than in one event as the cliff imagery would suggest.
The reality is that less than half of fixed rate mortgages have rolled off on to higher loans as of the latest data, despite the number of fixed rate loans expiring rising by up to 350% since the turn of the new year.
Back in April of last year, the overall proportion of mortgages on fixed rates reached almost 40%. As of the latest data, 21.2% of mortgages are still on low pandemic derived fixed rates.
In short, there is still a long way to go before all of the cheap fixed rate mortgages have rolled off on to higher variable rates.
This brings us to why we are here, what does the challenge of rolling off the average Aussie fixed rate mortgage actually look like compared with a sub-prime U.S borrower coming off their low teaser rate in 2007?
Teaser Rates Vs Mortgage Cliff
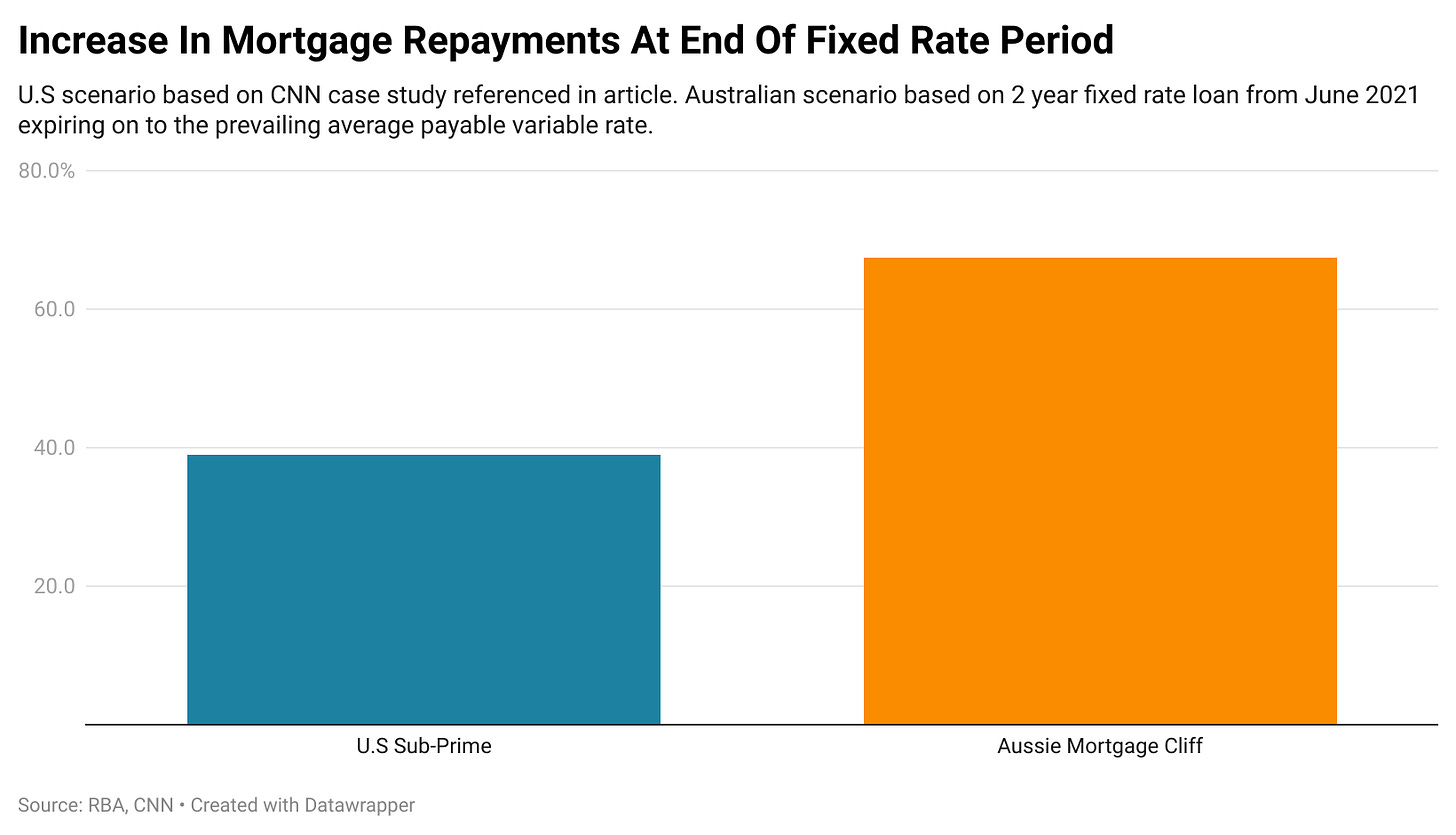
In the run up to the Global Financial Crisis, CNN produced a case study of a common scenario of an American household facing an expiring teaser rate mortgage. In the scenario a sub-prime buyer borrowed $200,000 in 2005 on a 2/28 hybrid ARM (2 years fixed at 4%, 28 years at a variable rate), in August 2007 they would see their repayments increase by 39%.
For Australian mortgage holders facing the expiry of their cheap fixed rate loans in the coming months, when the largest proportion will end, the challenge will be significantly greater.
Based on a household who got a 2 year fixed rate mortgage in June 2021 at an average rate (1.96%), now rolling off on to the average payable variable rate (6.24%), repayments are set to rise by 67.4%. Its worth noting that this assumes that a borrower shops around and gets the average payable rate, and doesn’t simply roll off the cheap fixed rate and on to a significantly higher than average variable rate.
Subprime Vs High Debt To Income
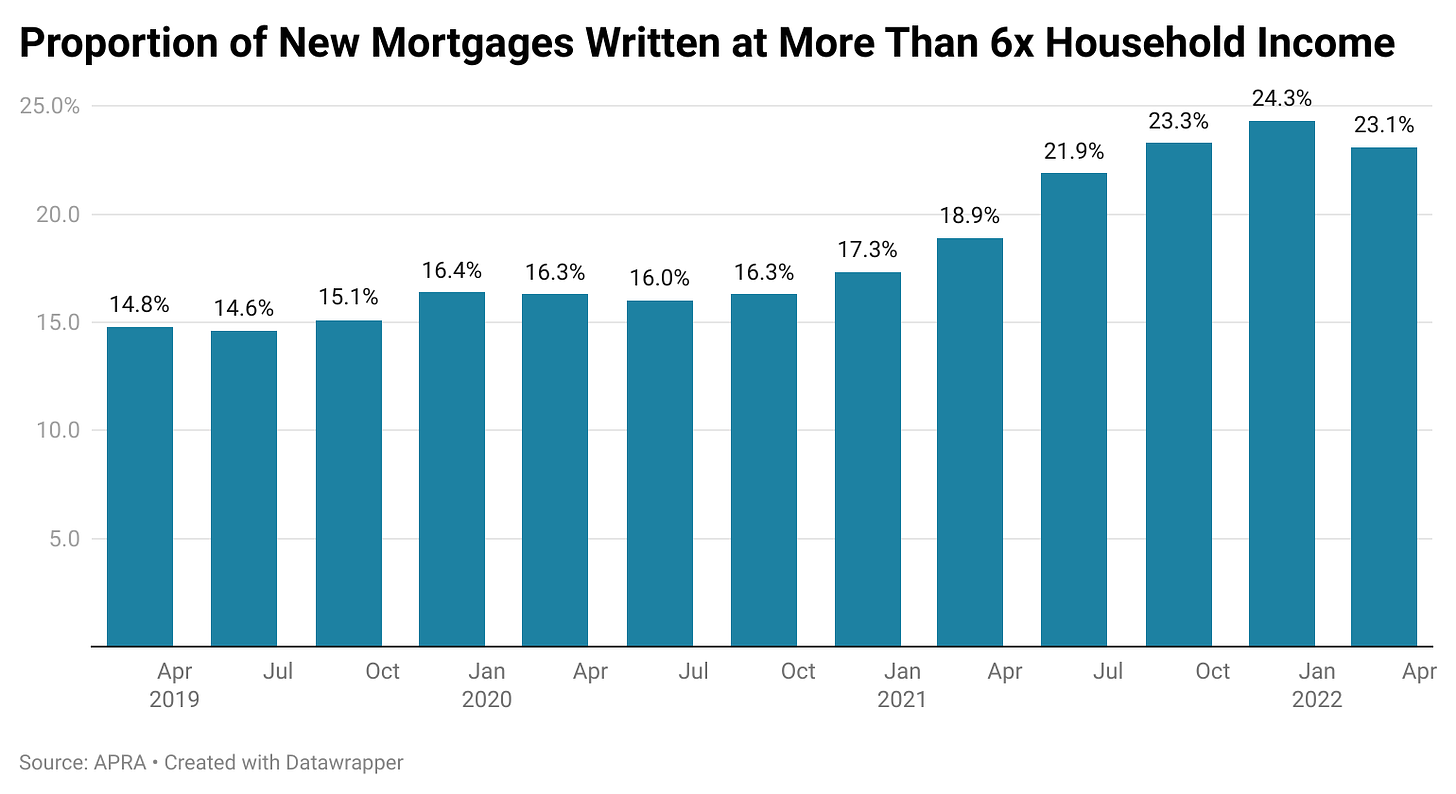
At the absolute peak of high debt to income lending during 2021, 24.3% of new mortgages were written under circumstances where a households total debts exceeded 6 times their household income.
In the underlying assumptions of today’s case study we’ll err on the relatively conservative side of things.
Our hypothetical household will earn $100,000 per year, slightly higher than the national median household income and will have borrowed 6.1x their household income using a 30 year mortgage. This is also roughly ballpark with the average mortgage size of $555k which was written in June 2021.
During the fixed rate period, the mortgage cost 26.9% of the households gross (pre-tax) income. Upon rolling off on to the average payable variable rate, the household will now be consuming 45.0% of gross income.
Prior to rates rising the major bank mortgage serviceability calculators came back with maximum debt to income ratios of around 6.7-6.9x. Its worth noting that major bank ANZ only stopped accepting debt to income ratios of 7.5x in May of last year and prior to October 2019 borrowers could borrow at up to 9x debt to income.
The RBA Take
Earlier this year the RBA released modelling on how higher rates would impact the cash flows of borrowing households if the cash rate was 3.6%. It found that 14.6% of borrowers would find themselves in negative spare cashflow.
Today the RBA cash rate is 4.1%.
Balancing It Out
While the challenge confronting Australian households with large mortgages rolling off low fixed rates is significantly greater than the one U.S subprime borrowers faced in 2007 on paper, in reality things are quite a bit different.
Unlike the GFC era U.S or past Australian credit cycles, we now live in a world defined by ‘Extend and Pretend’. Rather than households being driven to foreclosure, there is a willingness amongst lenders, the banking regulator and the government to look the other way or pretend a bad loan is good for a time.
That really is the crux of the entire situation, time.
If rates continue to stay roughly where they are, a sizable proportion of borrowing households are going to eventually find themselves is serious difficulty. For now, many households are comforting themselves with the idea that rates will be cut before they burn through what is left of their buffers. It’s entirely possible that they are right, after all, the RBA has shown in the past where its priorities lay.
But as the chart from the RBA above illustrates, a cut here and a cut there isn’t going to be enough to get most of the mortgage holders on course for serious challenges out of difficulty.
Ultimately, the longer the current business cycle persists, the higher the chance that Australian borrowers find themselves in serious trouble in sizable numbers.
— If you would like to help support my work by making a one off donation that would be much appreciated, you can do so via Paypal here or via Buy me a coffee.
If you would like to support my work on an ongoing basis, you can do so by subscribing to my Substack or via Paypal here
Regardless, thank you for your readership and have a good one.


